

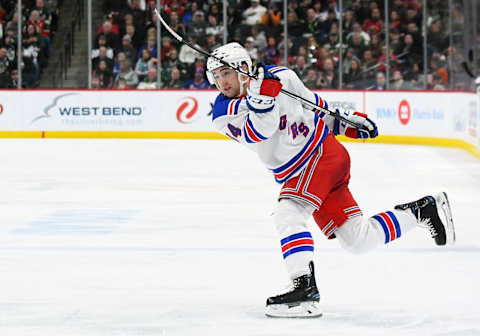
New York Rangers: Four crazy stats from the 2017-18 season

The New York Rangers’ 2017-18 season was the first in years in which they failed to make the playoffs. Blue Line Station took a look at five crazy statistics behind their worst finish since 2011.
The New York Rangers were a perennial playoff team for seven years, reaching the Eastern Conference Final three times and the Stanley Cup Final once in that span. The 2017-18 season, however, was a roller coaster that saw them fall short of the playoffs.
After a slow start in October, the Rangers got hot for a stretch and climbed back into contention before the injuries started piling up.
Following Chris Kreider’s banishment to the IR list, team management penned an open letter to fans. The letter, indicating their intention to sell at the deadline and rebuild, was a shocking admission of a lost season.
But for those paying close attention to the standings and the stats pages, that letter may not have come as much of a surprise. The Rangers, in fact, carried some awfully crazy statistics this past season.
Stat #4: 31st in the NHL in shot attempts percentage
On a game-by-game basis, the New York Rangers were simply crushed when it came to directing pucks toward the net. According to Corsica Hockey, New York came in dead last this season in Corsi For percentage, sustaining an abysmal 45.9% of shot attempts at 5v5.
They were nearly as terrible when it came to Expected Goals percentage, with only eight teams recording a mark worse than the Rangers’ 47.12%. The teams below them included the likes of the Arizona Coyotes, Buffalo Sabres, Vancouver Canucks, and Ottawa Senators.
It is no secret that this result was (in part) according to plan. Alain Vigneault’s offensive scheme was largely built around the Rangers’ speed and ability to counterattack through the neutral zone. However, the hybrid man-on-man scheme they used in the defensive zone didn’t help at all.
For the most part, the Rangers found themselves hemmed in and chasing pucks around the zone, while the other team fired away. The resulting imbalance in shot attempts is thusly no surprise.
Stat #3: Rangers record tumbles without Chris Kreider
The New York Rangers were one of the worst teams in the NHL without top-line winger Chris Kreider in the lineup. After he was diagnosed with blood clots, requiring surgery and expected to miss 6-8 weeks, the Rangers’ record plummeted.
On December 27, 2017, New York took a 1-0 shootout victory over the Washington Capitals. With that win, they sat at 20-13-4. That win was the last game Kreider would play until the end of February.
During that span, New York crashed and burned, amassing 21 losses in 28 games.
After Kreider’s return, they performed much better (despite selling off key players at the deadline) and finished 7-10-4.
Kreider’s importance to the team was noticeable, and he put up 15 points in those final 21 games.
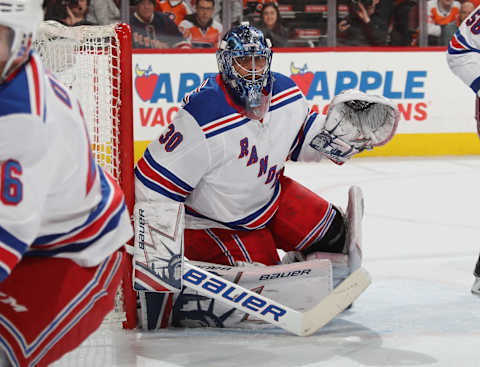
Stat #2: Henrik Lundqvist regains form
For years, the New York Rangers have lived and died by the play of Henrik Lundqvist. As he went, so, too, did the Rangers.
But last year, few people will argue that Lundqvist had anything but a down season. His numbers were poor across the board. His .910 save percentage was his worst in the NHL.
More telling, his Goals Saved Above Average number was poor. According to Hockey Reference, Lundqvist came in at -5.21, 46th among all goaltenders. After reigning supreme in that category for years, Lundqvist’s fall was shocking.
But this season, he rebounded. Lundqvist saved 4.70 goals above average, good for 23rd in the league. Removing goalies who played fewer than 30 games, Lundqvist jumps to 18th.
While that number is still declining, it’s a sharp jump up from last season. Indeed, with the deficient defensive personnel and system in front of him, Lundqvist performed close to his previous lofty standard.
Stat #1: Neal Pionk impresses, concerns
The New York Rangers found themselves in a precarious situation on defense after trading Ryan McDonagh and Nick Holden at the deadline in February. One third of their normal defensive corps was now gone, and Kevin Shattenkirk remained on injured reserve through the end of the season.
The time was ripe for the young guns to step up, and Neal Pionk impressed the most. As Blue Line Station’s Karly Redpath noted in her report card for Pionk, the right-shooting blueliner has good speed and makes an impact in transition.
Not only that, but Pionk put up points. He registered a goal and 13 assists in 28 games, with five points coming on the power play. More importantly, he recorded seven primary points, a good indicator for future production. He shoots a fair amount, too: 54 SOG in 28 games, matching Nick Holden’s number in 27 fewer games.
On the other hand, Pionk’s on-ice shot and scoring chance statistics were worrying. According to Natural Stat Trick, he finished dead last among Rangers skaters with a 41.61 Corsi For%. Even worse, the Rangers only enjoyed 41.76% of scoring chances while Pionk was on the ice at 5v5.
Next: Rangers' KZB lines stacks up against top lines in NHL
The eye test is kind to Pionk, and his counting stats show promise. The Rangers will have to hope that a new coach and a new system will help his underlying numbers improve next season.