New York Rangers: 2018-19 by the numbers

PITTSBURGH, PA - APRIL 06: Vladislav Namestnikov #90 of the New York Rangers celebrates his short handed goal during the third period against the Pittsburgh Penguins at PPG Paints Arena on April 6, 2019 in Pittsburgh, Pennsylvania. (Photo by Joe Sargent/NHLI via Getty Images)
1 of 3
Next
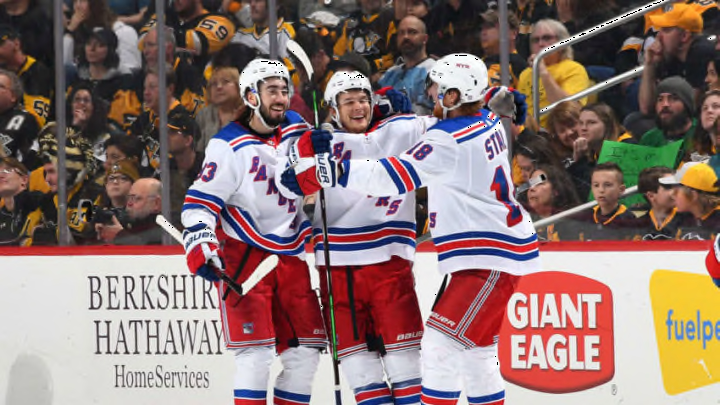
PITTSBURGH, PA – APRIL 06: Brady Skjei #76 of the New York Rangers celebrates his goal with teammates during the third period against the Pittsburgh Penguins at PPG Paints Arena on April 6, 2019 in Pittsburgh, Pennsylvania. (Photo by Joe Sargent/NHLI via Getty Images)
PITTSBURGH, PA – APRIL 06: Brady Skjei #76 of the New York Rangers celebrates his goal with teammates during the third period against the Pittsburgh Penguins at PPG Paints Arena on April 6, 2019 in Pittsburgh, Pennsylvania. (Photo by Joe Sargent/NHLI via Getty Images) /

The New York Rangers 2018-19 season is over and it’s time to take a look at some of the team’s statistics.

The old adage is that numbers don’t lie.  The New York Rangers were not a very good team this season and their statistics support that.  There are a few surprises, but the numbers make it very clear where the team needs to improve.

Personnel

The Rangers average age this season was 27.3 years.  That made the Rangers the 12th youngest team in the league and slightly younger than the league average of 27.8 years.   It’s important to note that the roster that finished the season averaged 25 years of age and would have qualified as the youngest team in the league.  Take out Henrik Lundqvist‘s 36 years and the average age was 24.5.

34 different players suited up for the Blueshirts this season, nowhere near the 49 different players who played for Ottawa or the 48 who played for Anaheim. San Jose used the fewest different players this season, only 28.

The Rangers only used two goaltenders, Henrik Lundqvist and Alexandar Georgiev.  They were one of ten teams that used only two goalies.  Compare that to the Philadelphia Flyers who tied an NHL record by using eight different netminders.

While it seemed like the Rangers at times fielded a team of rookies, they were not the team that used the most.  Ten rookies played for the Rangers this season, while Ottawa took the lead with 17 rookies.

Season record

We all know that the Rangers finished 32-36-14.  The Rangers went to overtime 23 times, the most in the Metropolitan Division.  That was almost twice the number of overtime games of Ottawa and Calgary who went to extra time only 12 times.

Florida, Chicago and Vancouver led the league by going to OT 24 times.

The Blueshirts had an overtime record of 3-9 and a shootout record of 6-5.   In 12 of those 14 overtime or shootout losses, the Rangers were outshot.

As far as shootouts, the six wins was tied for the league lead.  Their 11 shootouts were second to Vancouver’s 12.  The Rangers scored 16 times in the shootout, most in the NHL and four more than second place Buffalo.  Conversely, they allowed 13 goals in the shootout, second most in the league.

Resilience

For the Rangers, like most teams, scoring first was important. The only problem was the Rangers didn’t do it enough.  While their record of 10-5-4 when leading after the first period may seem good, their winning percentage of .526 was the third worst in the league.

The Rangers have a tradition of not losing when leading after two periods. Since the 2010-11 season, the Rangers have gone into the third period with a lead 246 times and only lost seven of those games in regulation.  This season the team went into the third leading 18 times and never lost in regulation.  Unfortunately, they went into the third period with a lead fewer times than any other team.  They also lost five of those games in overtime or a shootout so their winning percentage of .722 was worst in the league.

While they did a decent job of holding leads, the Rangers were not good at comebacks.  The fell behind after the first period in 27 games and went on to win only four times.   They went into the third period trailing in almost half of their games.  37 times they were trailing after two periods and they came back to win six times.

One amazing stat

At the end of the season we heard a lot about the number of one goal games the Rangers were in.  According to the official NHL statistics, the Rangers played 42 one-goal games and finished with a record of 18-10-14.   That ‘s a lot, but those numbers are not the real ones.

If you take out empty net goals that inflated the scores, the Rangers actually played 52 one-goal games.  That’s  63% of their games that were really decided by one goal, games that in most instances, were matches that they could have won.

The encouraging statistic is that they had a record of 24-14-14 in those one goal games.  A pessimist would say that they lost 28 of 52 one goal games.  An optimist would say that they won almost half and were able to get at least a point in 38 out of 52 one-goal games.

That record in one-goal games makes the next statistic we look at, the scoring by this team, an important one for the 2019-20 New York Rangers.   Increase the scoring and the number of closer games increases as well and this Ranger team showed that they can win those games.
NEW YORK, NY – MARCH 03: New York Rangers Center Mika Zibanejad (93) nets the puck past Washington Capitals Goalie Braden Holtby (70) during a regular season NHL game between the Washington Capitals and the New York Rangers on March 03, 2019, at Madison Square Garden in New York, NY. (Photo by David Hahn/Icon Sportswire via Getty Images)
NEW YORK, NY – MARCH 03: New York Rangers Center Mika Zibanejad (93) nets the puck past Washington Capitals Goalie Braden Holtby (70) during a regular season NHL game between the Washington Capitals and the New York Rangers on March 03, 2019, at Madison Square Garden in New York, NY. (Photo by David Hahn/Icon Sportswire via Getty Images) /

Scoring

While the Ranger defense is a sore spot, their offense was nothing to brag about.  Only seven teams in the NHL scored fewer goals than the 221 goals scored by the Rangers.  They averaged 2.70 goals per game, a half a goal less than they allowed per game.

Scoring was up in the NHL this season, with an average of 5.96 goals scored per game. That’s the most since the 2005-06 season when an average of 6.05 goals were scored.   The Rangers were right at the average with 5.95 goals scored per game they played. As previously noted, they only scored 2.7 of those 5.95 goals.

The Rangers scored most of their goals in the third period, however, they were outscored in every period,  65 to 74 in the first period, 65 to 87  in the second period, 88 to 97 in the third period.  That futility extended to overtime as they scored only three goals in OT while allowing nine.

Take more shots!

You heard it after every game from Coach David Quinn, the Rangers don’t shoot enough.  While the eye test was evidence enough, the numbers confirm it.

The Rangers had the fewest shot attempts of any team in the league. They attempted 3,381 shots in their 82 games.  The opposition tried 3,958 shots, a difference of 577 shot attempts. That was the second worst differential in the league and the shot attempt total against the Rangers was the fourth highest in the NHL.

Their lack of attempted shots was mirrored in their shots on goal.  The Rangers averaged 29.2 shots per game.  That was fifth fewest in the league.  While the Rangers had 2,393 shots on goal this season, Carolina led the league by taking 429 more shots.  That’s five more shots on goal per game than the Rangers took.  The Rangers allowed 33.8 shots on goal per game, the third most in the NHL.

Two Rangers, Mika Zibanejad and Chris Kreider, had more than 200 shots on goal this season.

It didn’t help that 52 shot attempts by the team ended up hitting iron.  The Rangers hit seven crossbars and 45 posts.  That total is much better than the 80 registered by the Vancouver Canucks.   Meanwhile, the Devils hit the fewest in the league, a total of 41.

Zibanejad has to be considered the unluckiest Ranger.  He hit 11 posts and one crossbar. The total of 12 was twice the next highest total, six by Kreider.  ZIbanejad’s 11 posts were third most in the league.

NEW YORK, NY – MARCH 25: Matt Murray #30 of the Pittsburgh Penguins tends the net against the New York Rangers at Madison Square Garden on March 25, 2019 in New York City. The Pittsburgh Penguins won 5-2. (Photo by Jared Silber/NHLI via Getty Images)
NEW YORK, NY – MARCH 25: Matt Murray #30 of the Pittsburgh Penguins tends the net against the New York Rangers at Madison Square Garden on March 25, 2019 in New York City. The Pittsburgh Penguins won 5-2. (Photo by Jared Silber/NHLI via Getty Images) /

The power play

The Ranger power play was very average, with a success rate of 19.4%, good for 17th overall in the NHL.   Oddly enough, they were more successful on the road (20.4%) than at home (18.5%).   That road percentage put them in 11th place overall.

The one thing the Rangers didn’t do was draw a lot of penalties.  They had 227 power play opportunities which was 22nd in the league.  They were 25th in the NHL with just under 372 minutes on the power play.

While they were 19th overall with 44 power play goals scored, none of them came with a two-man advantage.  The Rangers were one of seven teams with no goals on the five on three and they had more time (7:07) with a two-man advantage than any other team.

Of the 44 power play goals they scored, 25 were scored by the trio of Mika Zibanejad, Chris Kreider and Pavel Buchnevich.

They allowed only four shorthanded goals all season, fifth best in the league.  Four is a much better number than the 15 allowed by the Penguins.

The penalty kill

When it came to taking and killing penalties, the Rangers had a lot of problems.  Their penalty kill was 78.2%, fifth worst in the league.  That lousy success rate had a major impact because the Rangers led the league by averaging 10:24 per game shorthanded.

They led the league in penalty minutes with 854 and were shorthanded 266 times, fourth most in the league.  As a result they allowed the third most power play goals in the league (58).

The Rangers road penalty kill was third worst in the NHL at 76.3%

On a positive note, they scored 7 shorthanded goals, 14th best in the league.  Calgary led the league with 18.  Three Rangers (Hayes, Zibanejad, Namestnikov) scored twice so no one player excelled.

Oh, let’s not forget the too-many-men-on-the-ice penalties.  They led the league with 15 bench penalties of which 14 were for too many men.  That’s a bad number that reflects the youth on the team (we hope).

The Rangers were pretty feisty as they led the league with 28 major penalties.  They were third in the league with eight misconducts.

Faceoffs

This is one area where the Rangers definitely need to improve.  They had the second worst winning percentage in the league at 46.9%.  Only Washington was worse with 45.7%  Compare that to the Flyers who won 54.7% of their draws.

No Ranger won more faceoffs than he lost.  Zibanejad led the team with a 49.6% and rookie Brett Howden showed some promise early in the season, but faded to a 48.6%. Their other young centers need a lot of work.

At even strength, they won 46.7% of their faceoffs and did okay on the power play, winning 51.2%.

Two areas just killed them.  On the penalty kill, they won just 44.5% of their draws and they were the worst team in the league when it came to defensive zone faceoffs with a 45.5% winning percentage.

Go figure, the Rangers took the third fewest faceoffs of any team in the league, averaging 57 a game.  Considering their lousy winning percentage, that was a good thing.

With so many young centers on the team, one would hope that the team is going to invest in someone who can teach these players how to win more draws.

Odds and ends

There were a few other statistics worth nothing.  The Rangers hit a lot.  They were fifth in the league in hits with 2,128.  They were led by Brady Skjei with 178.  Skjei averaged 2.3 hits per game and was surpassed by Brendan Lemieux who average 2.5 hits per game.

They were 11th in the league with 1,213 blocked shots.  Skjei and Marc Staal had identical totals with 119 hits, averaging 1.5 per game.

On the negative side, they were third in the league with 1,039 giveaways. The worst offender was Tony DeAngelo, followed by Zibanejad.

Are you bleary-eyed from all of these numbers?  Maybe so, but they do paint a picture of where the Rangers came up short in 2018-19.   Some are an indication of the youth and inexperience of the roster and others point to the challenges the team has with defense.   The lack of shooting is disturbing considering how Quinn has harped on that issue all season.

More. Jack Hughes or Kaapo Kakko. light

There is a lot to work on for Coach Quinn and his staff.   If they don’t show improvement in a number of these areas, it could be another long season.

Next